
(1) Pop-up project proposal/outline
During our first class on 4th September, bring a photo/diagram of your chosen instrument (or if possible, a real instrument) and be prepared to talk about it for five minutes covering:
(a) The name of the instrument or instrumentation system, what it measures and how.
(b) An example of a significant finding made using this instrument.
(c) Why you chose it.
(2) Project paper and presentation
Write a short paper (3-4 pages, including figures) on the role of this instrumentation in modern research oceanography, touching on the following points:
(a) What kind of phenomena is the instrument used to observe? What significant knowledge about the ocean has it contributed?
(b) How does the instrument work? How is it deployed? What time and space scales can it capture?
(c) What are the strengths and weaknesses of the instrumentation? What uncertainties are there in the scientific results and conclusions made based on its data? How do these uncertainties relate to limitations in instrumentation and sampling?
Configure your paper into a ten minute talk (10 slides maximum), to be presented in class.
Lecture
23: Instrumentation and Experimentation
Chapter 16 of Descriptive Physical Oceanography by Talley (2011) focuses on methods and instrumentation
for measuring the large-scale circulation and water properties of the ocean. Chereskin
and Howe (2007) provide a compendium of in situ and satellite
instrumentation and their uses in modern research oceanography
(see link below). The instrumentation and experimentation they
describe are for dynamical measurements of the ocean,
including temperature, salinity, and pressure for density.
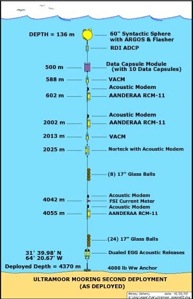
Following is a brief list of some of the more common
instrumentation in physical oceanography.
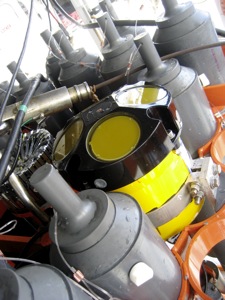
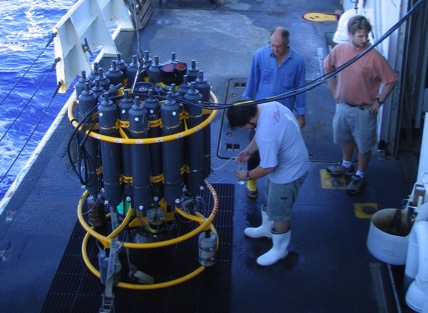
CTD
- “Conductivity Temperature Depth” - measures salinity (S),
temperature (T), and pressure (P). The true workhorse of
physical oceanography. Usually combined with sampling bottle
rosette, as seen in the photo to the right.
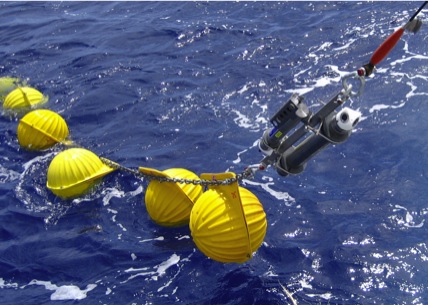
ADCP
- “Acoustic Doppler Current Profiler” - measures velocity. Can
be deployed on a mooring, on a CTD package, or mounted in the
hull of a ship. All US research vessels have hull-mounted
ADCPs.
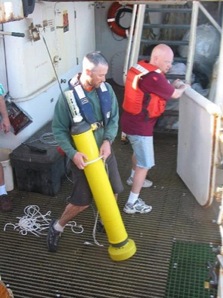
Argo
float - floats with the currents at a fixed pressure
(typically 1000 m) for a number of days (typically 10 days),
then dips to 2000 m before rising to the surface, collecting a
T,S,P profile. Once at the surface, floats transmit data to
Argos system of satellites, before sinking again to repeat
their mission. The Argo observation system consists of over
3000 floats worldwide.
CPIES
- “Current meter and Pressure sensor equipped Inverted Echo
Sounder” - measures velocity, pressure, and acoustic travel
time. Moored on the bottom of the ocean. Typically used to
estimate dynamic height and oceanic heat content.
Talley, L. D. (2011).
Descriptive physical oceanography: an introduction. Academic press. https://doi.org/10.1016/B978-0-7506-4552-2.10028-9
Chereskin,
T, and B. Howe (2007)
Oceanographic Measurements. In Springer Handbook of
Experimental Fluid Mechanics. Eds., Tropea, C., A. L. Yarin
and J. F. Foss. Springer, Berlin, 1179-1217.
Copyright
Chris Linder, WHOI